Platform overview
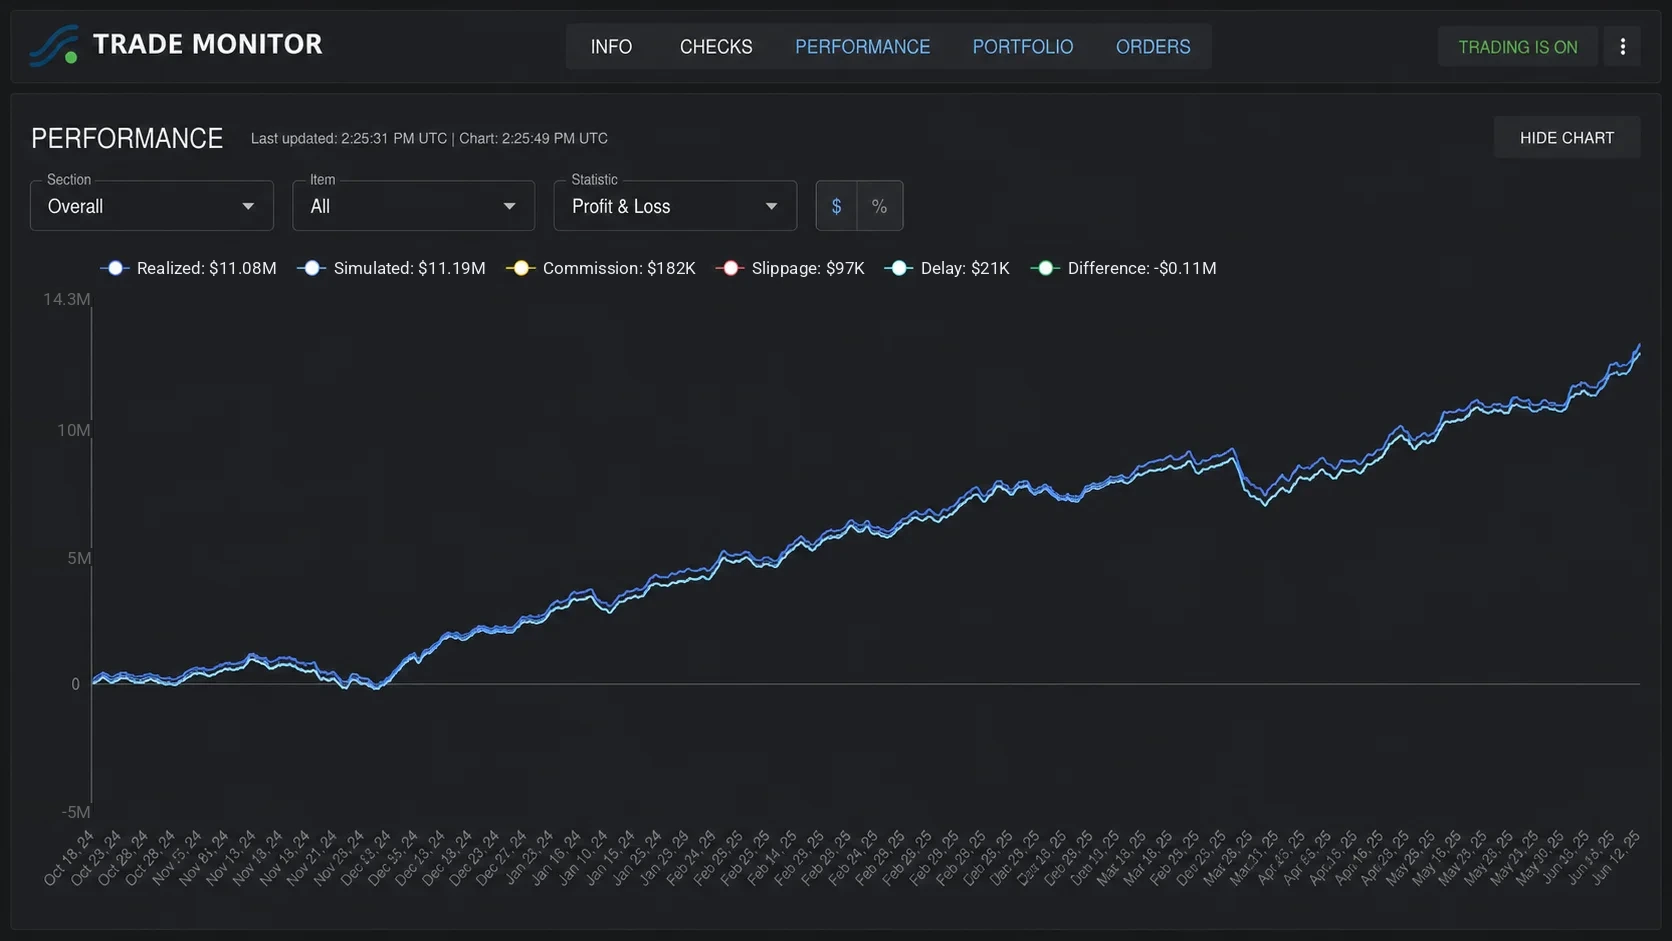
Live Execution
Live monitoring of portfolio performance, side by side with the simulated numbers.
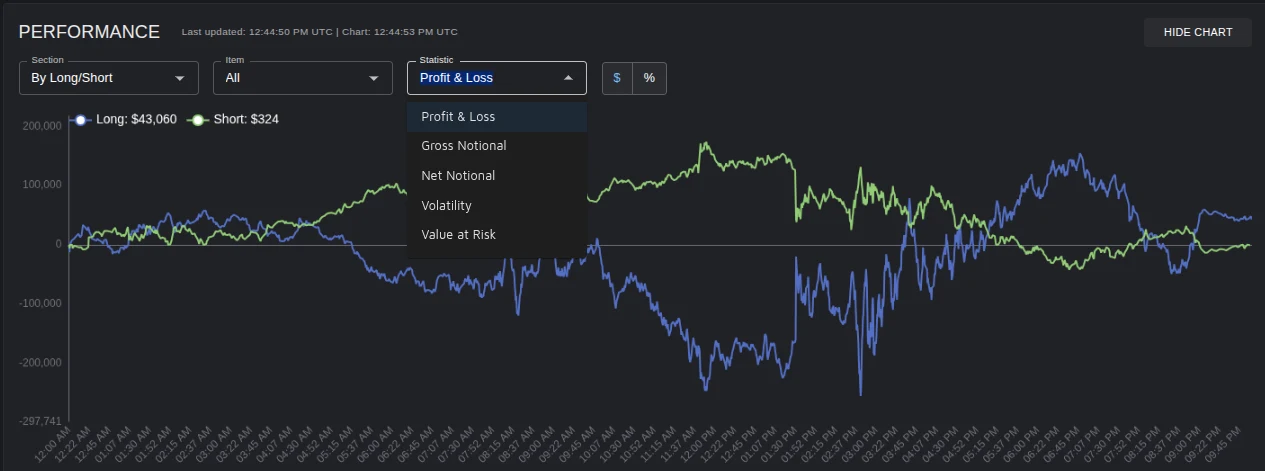
A full set of live statistics, sliced by strategy, long/short, sector and security.
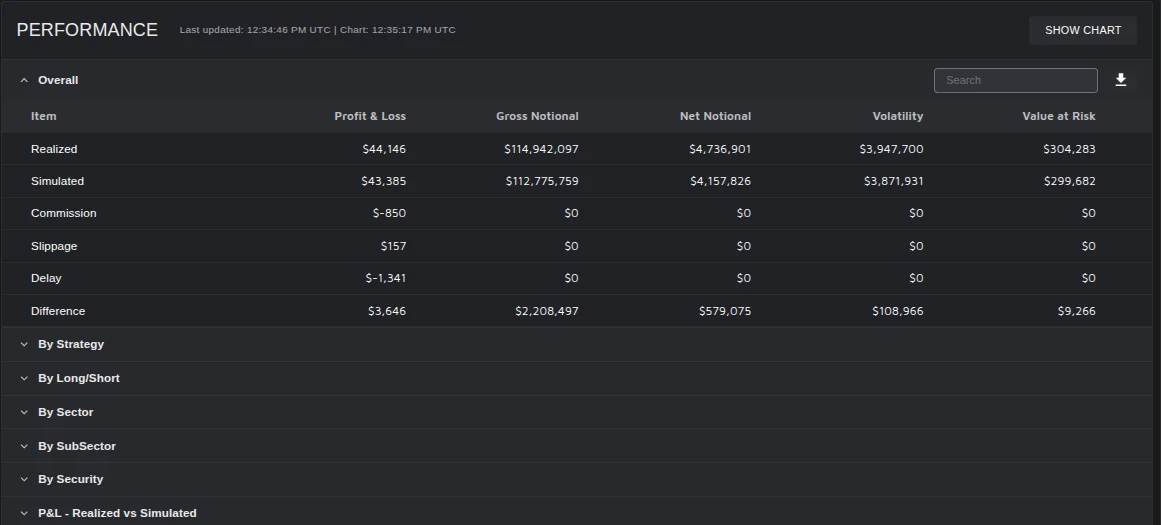
Detailed analysis of performance and risk metrics, all updated in real time.
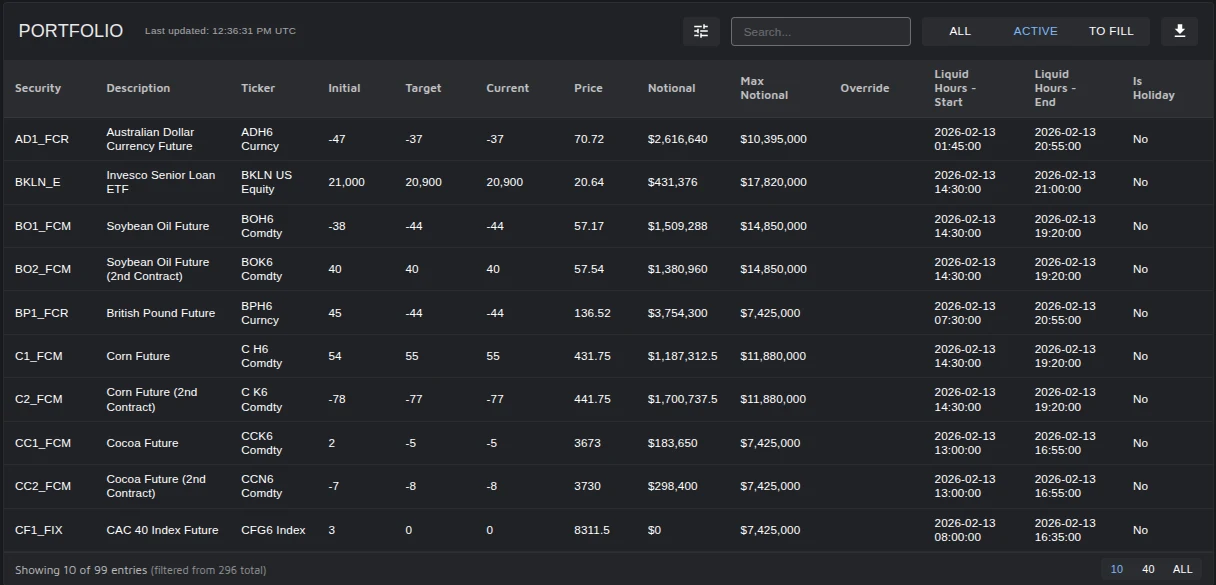
The portfolio at a glance: current versus target positions, notionals and other customizable fields.
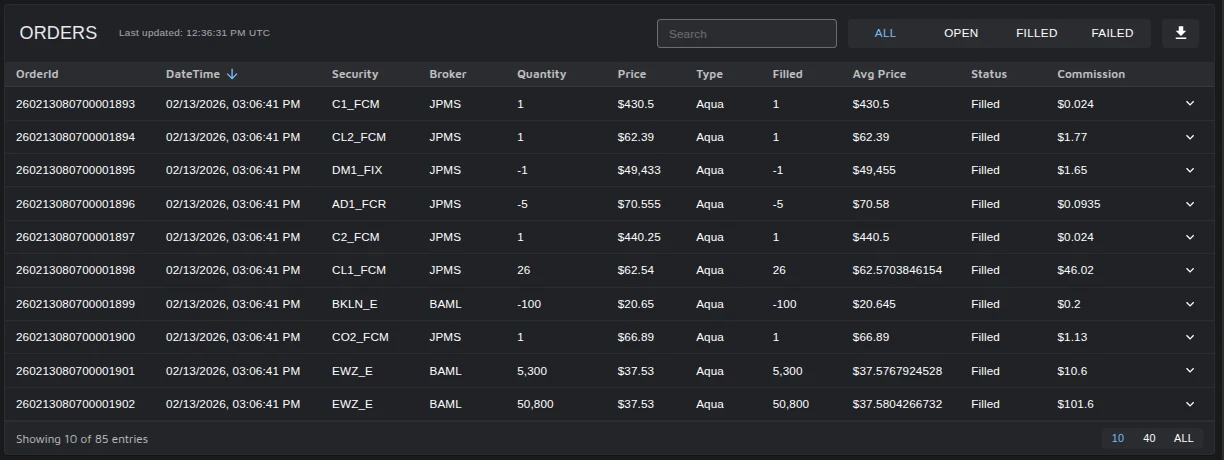
The order blotter: every fill with broker, algo, average price, status and commission.
Features:
- Automated front, middle and back office: live execution without building the infrastructure.
- Live performance continuously compared against the simulation, with slippage and drift analysis.
- Risk management and position monitoring across strategies and accounts.
- Review trading activity from anywhere (phone, tablet, desktop, etc).
Backtesting
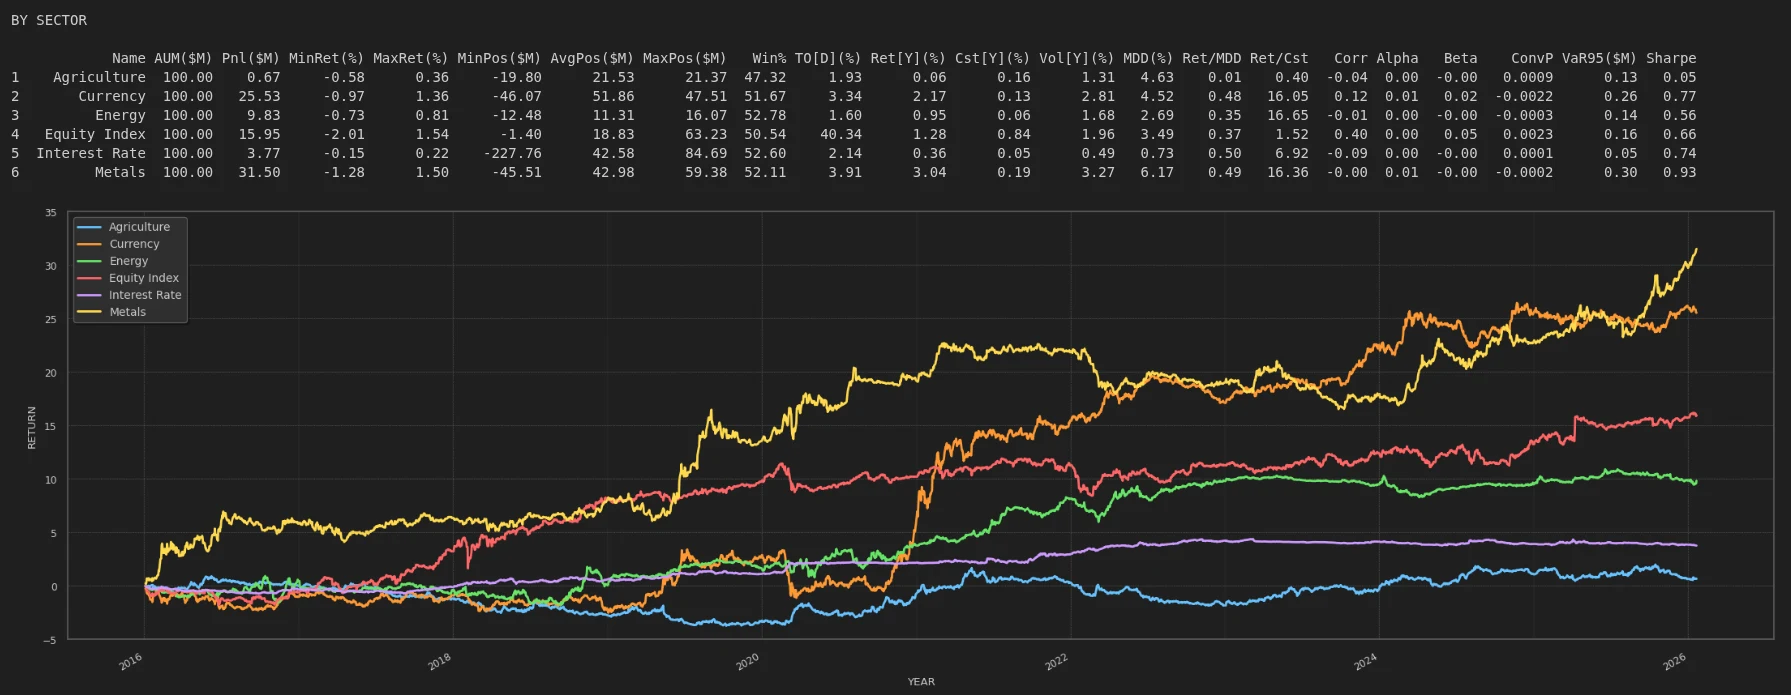
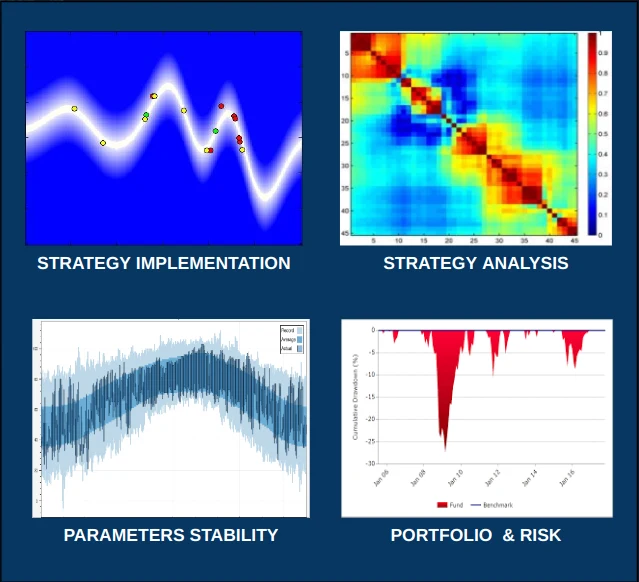
Every backtest dissected: statistics and equity curves by sector, long/short, instrument type and more.
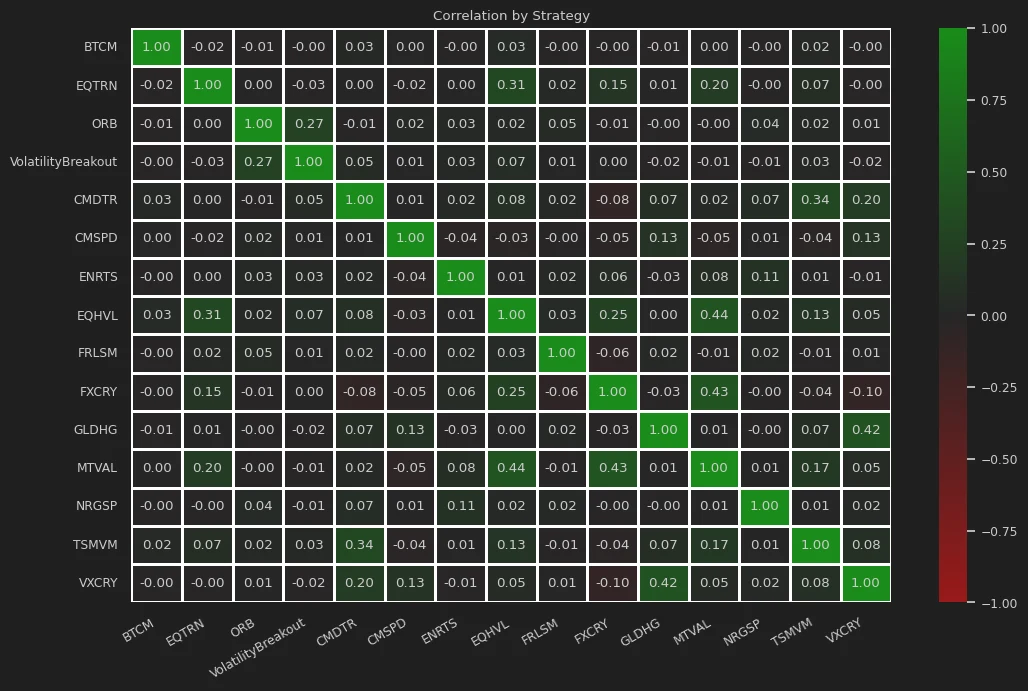
Correlations across strategies, to build portfolios that diversify rather than overlap.
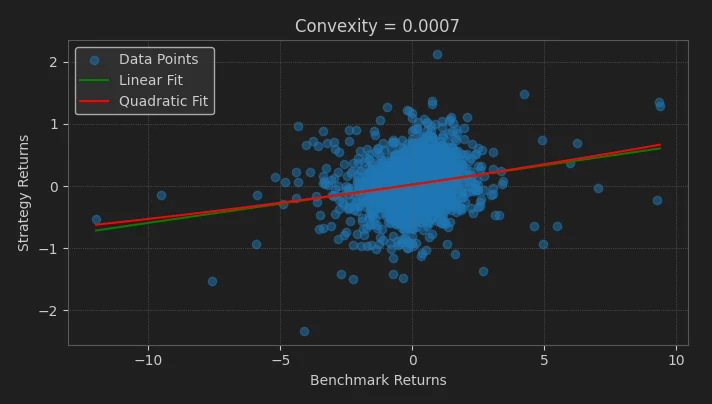
Convexity analysis: strategy returns against the benchmark.
From strategy implementation to analysis, in one integrated research environment.
Features:
- Realistic backtesting: costs, slippage and liquidity modelled so results survive live trading.
- Parallel simulation on the cloud or in calc-farms, on daily/snapshot and minute data.
- Interface in Python, implementation in C++.
- Portfolio construction and risk-analysis tools.
-
Proprietary reports to analyze trading strategies:
- Sensitivity analysis
- Costs analysis
- Parameters & overfitting analysis
- Analysis by long/short, instrument type, sector, etc.
AI Strategy Lab
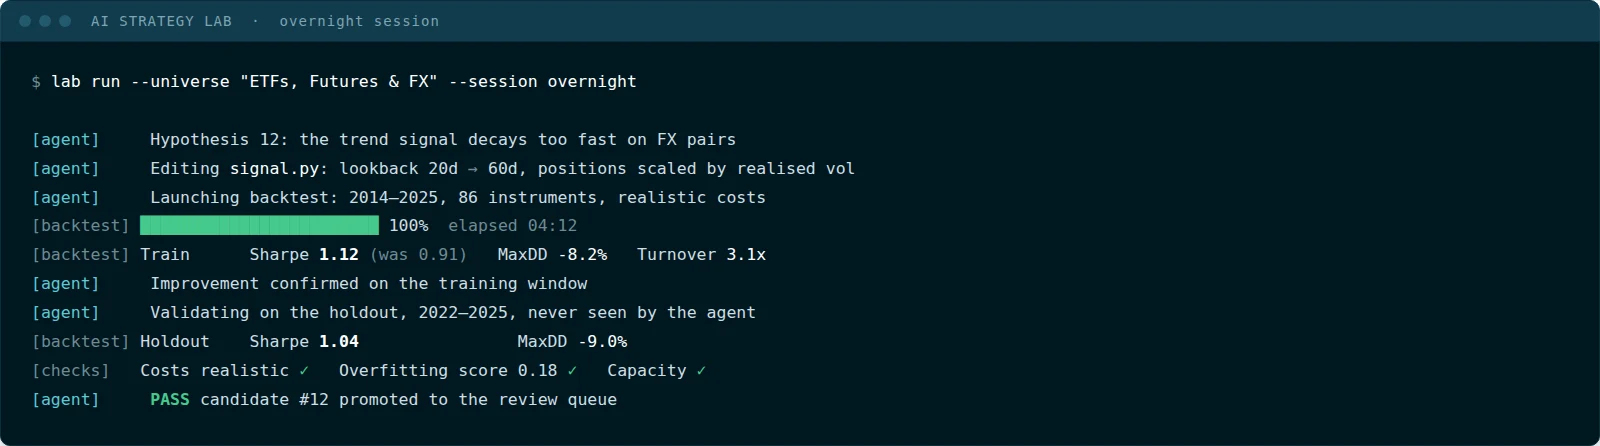
The lab at work: the agent forms a hypothesis, edits the code, backtests it with realistic costs and validates it on a holdout it has never seen.
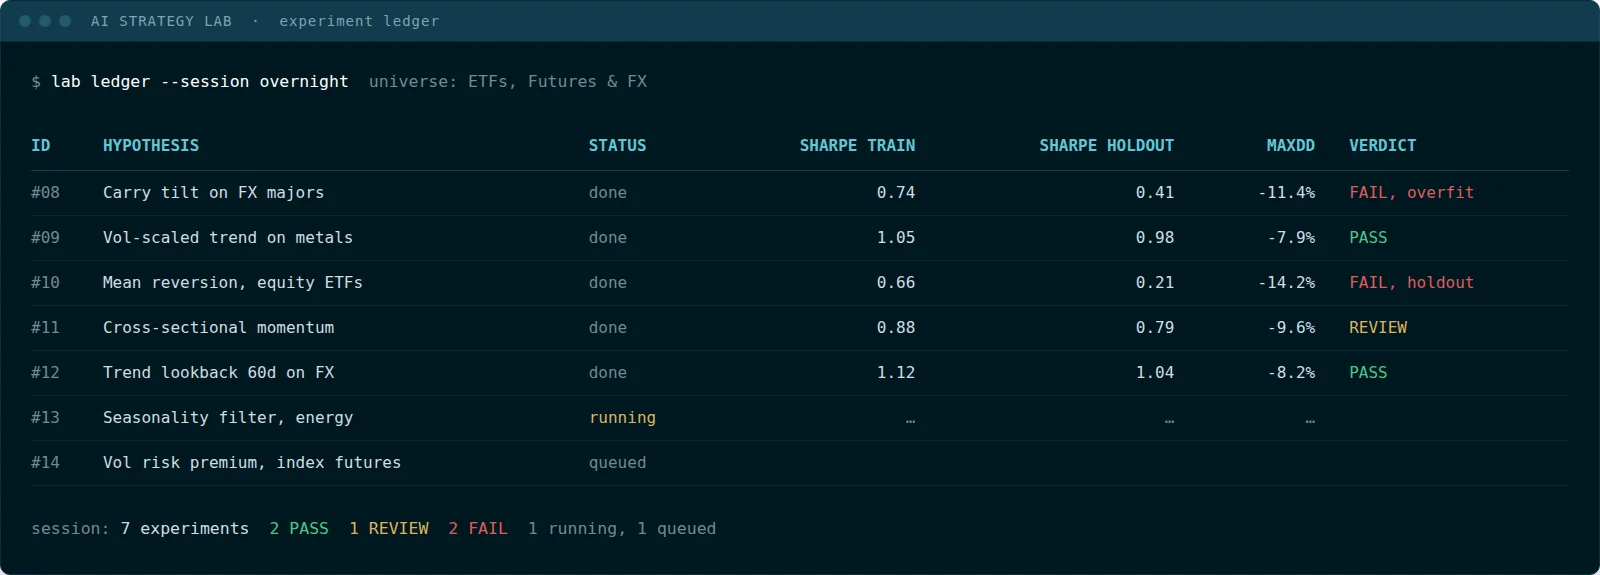
Every experiment tracked in a ledger: hypotheses, results and verdicts, accumulated while you sleep.
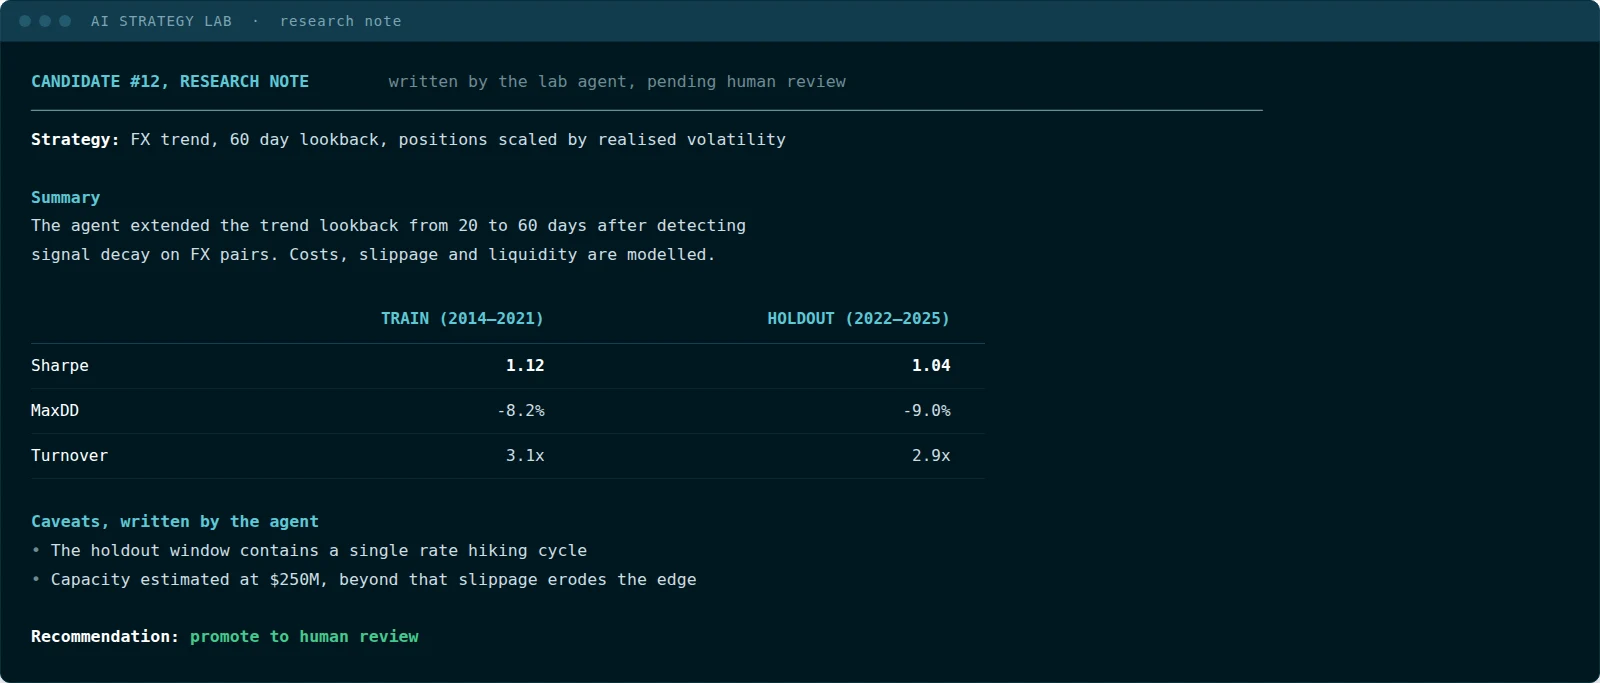
Each candidate ends in a research note written by the agent, with its own caveats, ready for human review.
Features:
- AI agents that design, code, backtest and refine systematic strategies, from idea to tested candidate.
- Proprietary research methods developed in-house by a team of experts in statistics, finance and machine learning, including patented strategy-evaluation technology (US patent 12,271,950).
- Every candidate is validated by the same realistic backtesting engine used for live strategies.
- The IP of every strategy developed with the lab is owned by the client.
Reporting
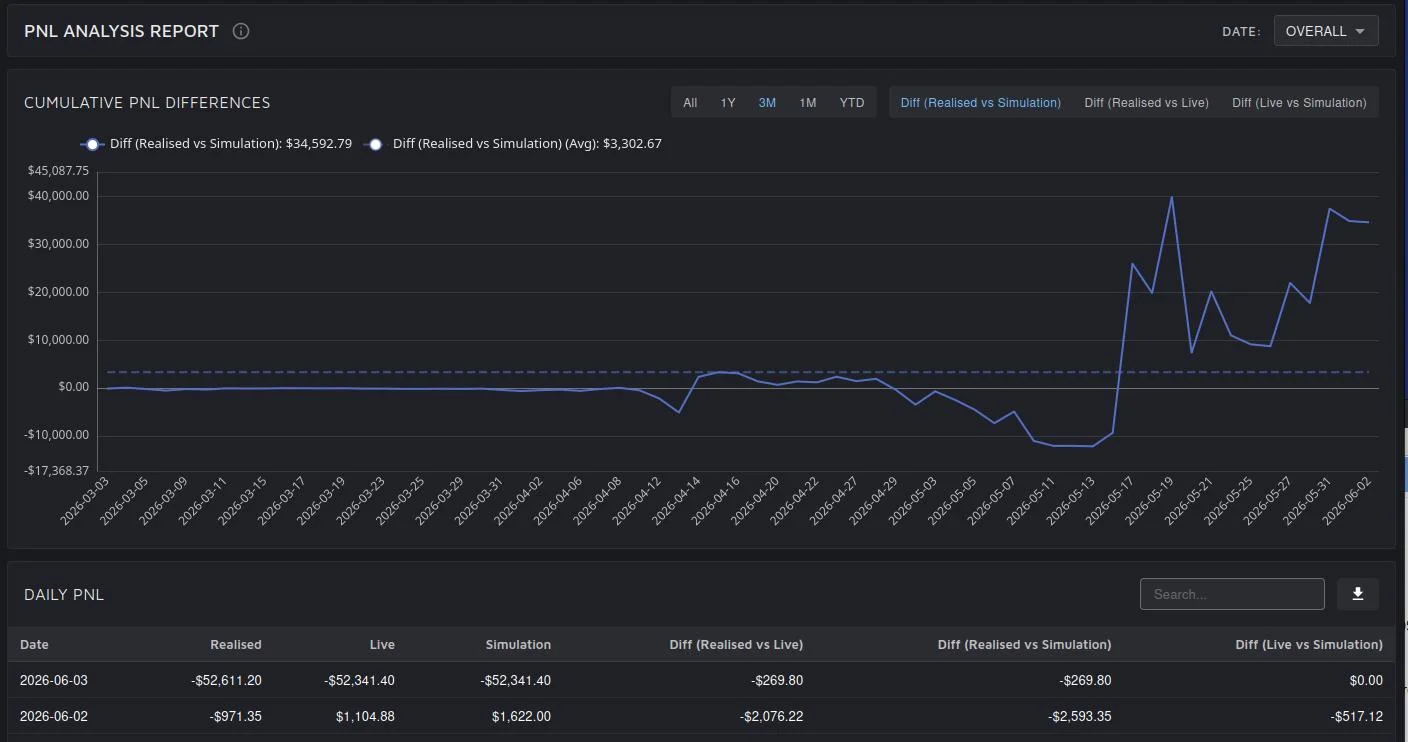
PnL analysis: realised, live and simulated results compared day by day, with cumulative differences tracked over time. Anomalies can be investigated down to the level of each security.
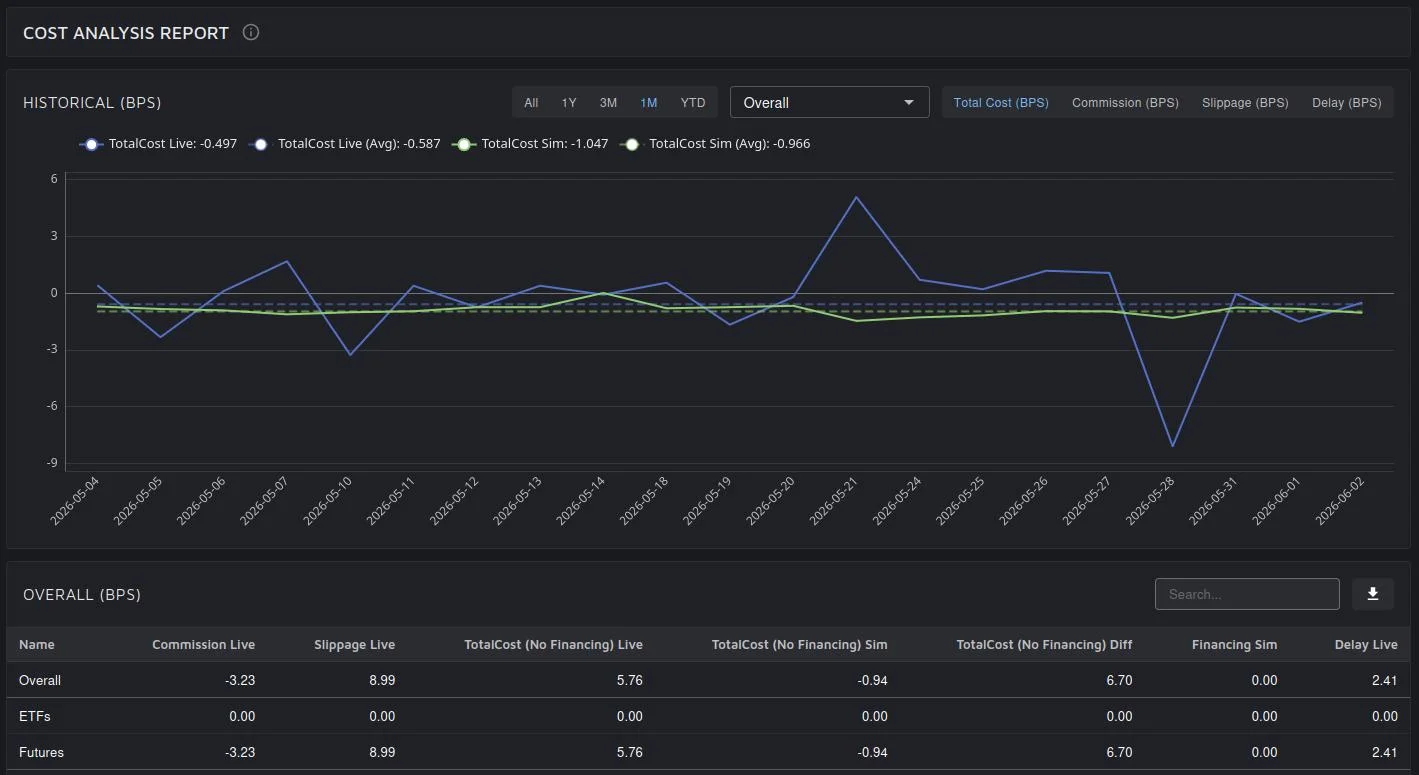
Cost analysis: commissions, slippage and delays measured in basis points, live versus simulated, by instrument type and down to each security. Over time, this allows building increasingly accurate cost estimates for every security.
Features:
- Daily comparison of realised, live and simulated results.
- Cost attribution in basis points, by instrument type and down to each security.
- Date-range filters and one-click export on every table.
- Custom reporting is also available upon request.
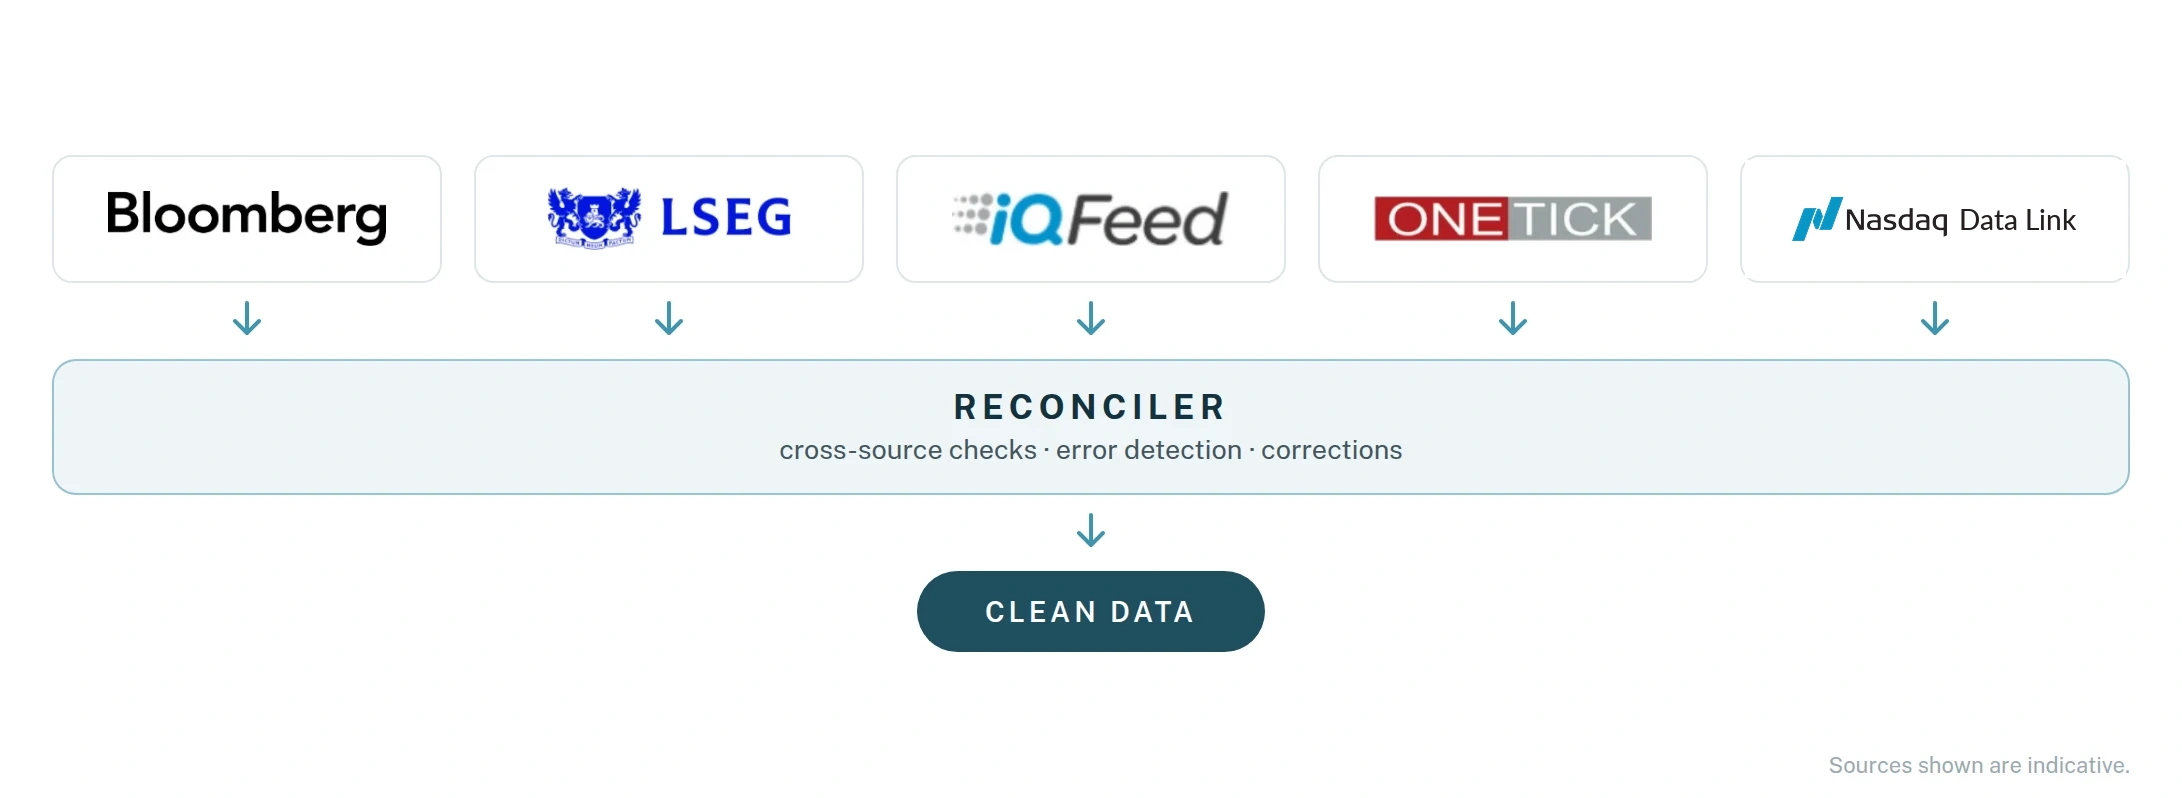
Data Cleaning
We reconcile your data sources with our proprietary algorithms, or simply provide our own clean data.
Features:
- Automated error detection and correction, with tools for manual review.
- Data distributed as analytics via cloud.
- Supports stocks, ETFs, futures, options, and currencies.
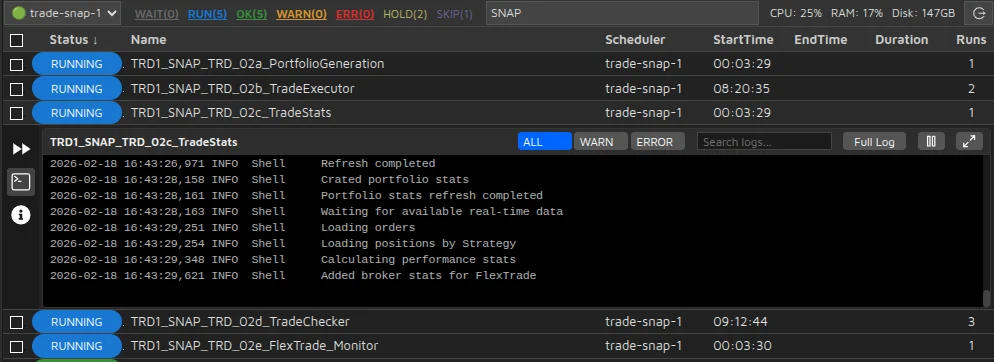
Operations
The entire daily operation runs as scheduled jobs, from data snapshots to compliance copies, each with a clear status.
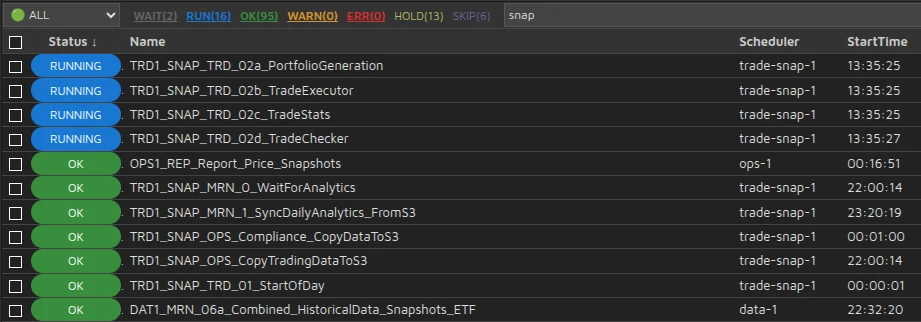
Every process monitored in real time, with live logs for each job.
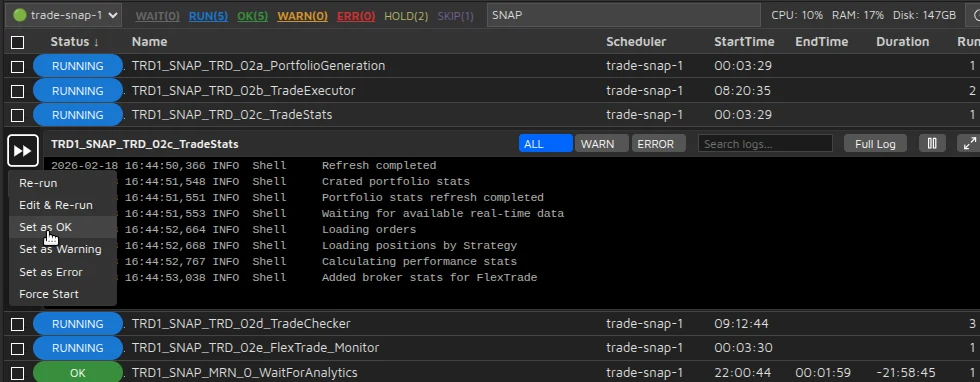
Full manual control when needed: re-run, edit or force any step directly from the dashboard.
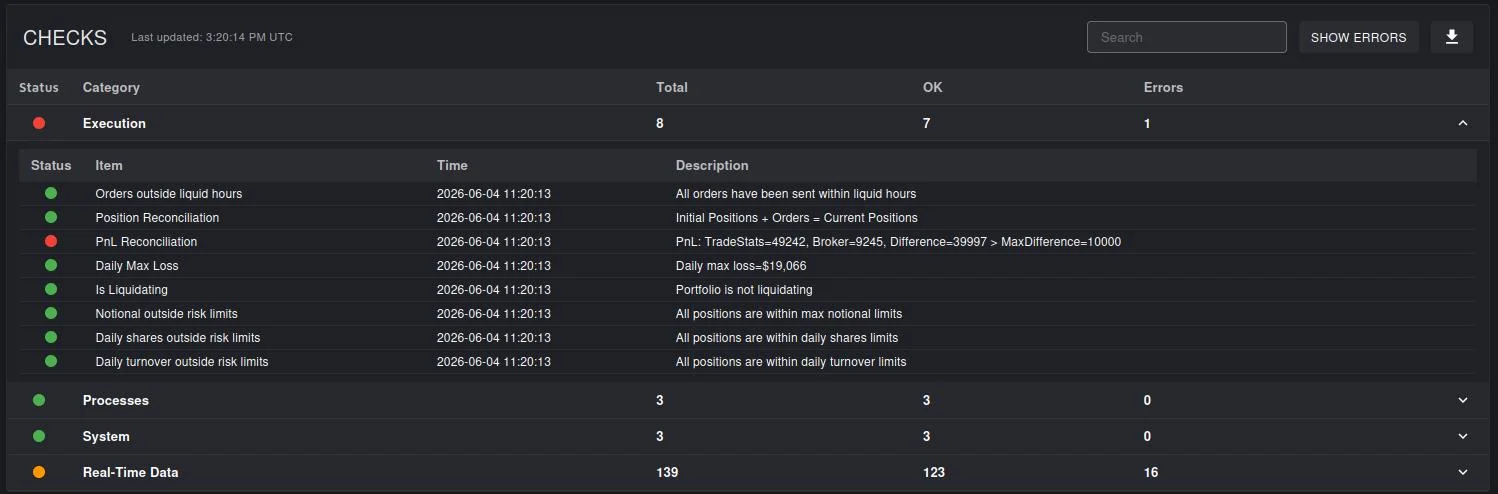
Automated checks across execution, processes, system and real-time data, with every breach flagged immediately.
Features:
- Continuous trade monitoring with automated alerts, so strategies are watched after they go live.
- Automated reconciliation of cash, positions and trades.
- Compliance controls and logging built into the trading workflow.